Back to News & Insights
Research | 01.22.2024
Emerging Markets Credit: Resilience
Gaby Szpigiel and Marathon EM Team
Stages
In the fifth century BCE, the Greek philosopher Zeno of Elea proposed the following paradox: suppose the mythical huntress Atalanta, renowned for her running speed and ability to cover great distances, wishes to reach the end of a path to capture a prey. That which is in locomotion must arrive at the halfway stage before it arrives at the goal. For Atalanta to reach her destination, she must first run halfway. Before she can reach the halfway stage, she must first run a quarter of the way. Before traveling a quarter of the way, she must first travel an eighth of the way. Before traveling an eighth of the way, she must first travel a sixteenth of the way, and so on ad infinitum. Thus, as Zeno of Elea’s paradox illustrated, travelling an infinite number of finite distances cannot be completed nor begun, motion is an illusion, change is not possible.
A full rates cycle, or the time between troughs in the federal funds effective rates, includes different stages. The velocity with which one ends and another one begins can vary significantly. The current rate cycle includes the fastest increase in the federal funds rate since the Federal Open Market Committee (“FOMC”) began targeting the effective rate in 1982. This dramatic rate of change motivated the market’s quickly changing sentiment surrounding the rates cycle, which then spurred narrower and quickly evolving interpretations of market conditions. Market sentiment cycled through policy-triggered recession fears, policy-triggered banking fears, goldilocks scenarios, higher for longer duress, and the certainty of peaking rates, all within a span of twelve months. A narrow view or interpretation of events can cloud the perception of movement and fail to capture the possibility of change. A broader view can dispute this lack of change and highlight how an asset class, traversing through a full rate cycle, has positively evolved.
Turbulence
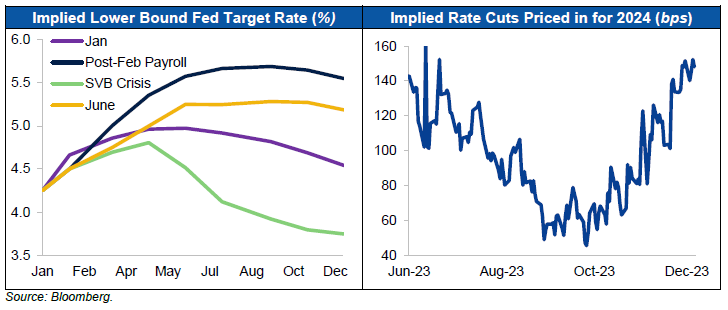
Remarkable shifts in the market’s narrative surrounding rates occurred throughout the calendar year. The year started with the lower bound of the federal funds target rate at 4.25%, and with markets pricing in 50-75 bps of additional rate hikes and the start of a rate cutting cycle before year-end. By the end of February, based on a large upside surprise in US payrolls, the market quickly repriced, leading to 100 bps in expected future hikes. In March, bankruptcies in the financial sector (which included US regional banks Silicon Valley Bank, Signature Bank and First Republic, and global bank Credit Suisse) upended the market narrative once more. Following this banking upheaval, the market quickly priced out most of the assumed hikes, at one point even anticipating 100 bps of rate cuts by year-end. The Federal Reserve (“Fed”), the US Treasury and the FDIC would eventually step in to reassure depositors. Two weeks after the collapse of Silicon Valley Bank, the Fed would deliver the second hike of the year. Over the following months, the Fed delivered two additional hikes, in May and in July, reaching a target rate lower bound of 5.25%.
Despite this historically aggressive tightening, the US economy remained persistently strong, fueling a negative narrative built upon concerns over the potential economic consequences of structurally higher for longer rates. Concerns were heightened by a third quarter Fed release; the September Fed Summary of Economic Projections showed a revised view, where 10 out of 19 Fed officials believed that rates should be above 5.0% by the end of 2024. Eventually, weaker payroll data and softer-than-expected CPI prints during the last few weeks of the year would serve to boost market sentiment. While at many times fearing that motion is an illusion and that change is not possible, market perception finally arrived at the conclusion that the Fed was reaching the halfway point of the rates cycle.
Reaction
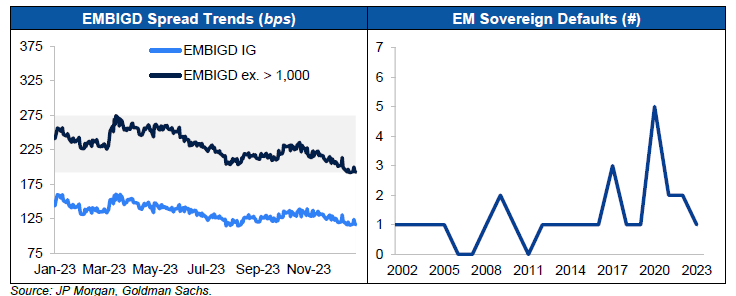
Spreads – In a year marked by the highest rates volatility since the Great Recession, EM spreads remained remarkably contained. Over the course of 2023, spreads for the Index compressed 69 bps, from 452 bps to a year-end close of 383 bps. Most of this spread compression was seen in the high yield (“HY”) segment of the Index, where EM HY spreads compressed 122 bps, from 823 bps to a year end close of 701 bps. A further segmentation of spreads based on credit rating reveals signs of market resilience. For example, when we consider EM Investment Grade (“IG”), which represents the majority of the market cap of our Index, the spread differential between the year’s maximum and minimum levels stood at only 46 bps. Even at the height of policy-triggered banking fears, IG spreads had only widened 26 bps relative to the start of the year. Even at the height of the peaking rates end-of-year euphoria, IG spreads had only tightened 18 bps relative to the start of the year. If we conduct a similar exercise for all EM, excluding jurisdictions where spreads reached above 1,000 bps during 2023, data points suggest a similar pattern. This pool of credits oscillated throughout the turbulent year between a maximum of 274 bps and a minimum of 192 bps, or within an 83 bps spread range. Notably, within this spread context, EM’s relative value proposition stands firm. When we compare EM to a basket of US High Grade and US HY, EM spreads stand above 141 bps, well above historical averages of approximately 53 bps over the last decade.
Ratings – In 2023, there were more EM sovereign credit rating upgrades than downgrades; a data point that suggests resilience. EM experienced 16 sovereign upgrades versus 10 downgrades. According to S&P, the balance of outlooks on sovereign ratings at the end of 2023 (positive minus negative) stands at negative 3, compared with negative 13 in December 2022. For 2024, 11 sovereigns are on a positive outlook, while 14 are on a negative outlook. Fitch ratings shows a similar stabilization trend, with a balanced picture in terms of upgrades and downgrades, or a net upgrade of one in 2023. The outlook for 2024 is similarly balanced, with approximately 10 ratings on both positive and negative outlooks.
Defaults – The pandemic-induced global economic crisis elevated concerns surrounding the potential for a wave of defaults within the EM universe. In 2020, following the adoption of social mitigation policies which brought global economic activity to a near halt, credits that were already dealing with pre-pandemic struggles were forced to default or restructure, such as Argentina and Ecuador. Given the negative effects of rising rates, concerns surrounding the potential for numerous defaults once again resurfaced. Evidence suggests that these concerns were once again overstated. Since the Fed began to raise the target rate, and even while the magnitude of change has been historically unprecedented, defaults remain subdued. Two instances of sovereign defaults occurred in 2022 and one instance in 2023. In December 2023, Ethiopia (approximately 10 bps weight in the Index) opted for non-payment on a coupon of its $1 billion 2024 bond after reaching an agreement in principle with official and bilateral creditors on a debt service suspension, while the government holds talks with the International Monetary Fund (“IMF”).
Moving Forward
Over the centuries, philosophers and theoretical mathematicians have grappled with the implications of Zeno's paradox on concepts of motion, change, and infinity. Many struggled to negate its conclusion that true advancement is impossible. EM has endured notable shocks both internally and externally in recent history. For market participants, it can be easy to fall victim to Zeno's premise, specifically, that EM is in a permanent state of emergence. On the contrary, the performance of the asset class through the accelerated and pronounced hiking cycle serves as evidence of positive motion and positive change. EM has reached a stage of resilience. Reaching this stage of resilience was aided by a diverse set of positive developments, including the underlying strength of local economies, proactive policy initiatives, and reduced funding dependency on external public markets.
Growth – Since global central banks began raising rates, fears of a pronounced slowdown in economic activity have remained part of the macroeconomic discussion. Defying some market participants’ expectations, developed markets (“DM”) have been able to avoid a recession. Aggregate DM managed to record positive estimated GDP growth of 1.5% for 2023, down from 2.5% for 2022. The World Bank recently released its updated economic global output report. In the report, the World Bank assumes DM will be able to avoid a recession through the next chapters of the rates cycle, with estimated growth forecasts of 1.2% in 2024 and 1.6% in 2025. Along with DM, EM has displayed remarkable economic endurance. For 2022, EM recorded a 3.7% growth rate in a year where China, facing a variety of issues, only grew by 3.0%. The World Bank estimates that EM grew by 4.0% in 2023, increasing the growth differential relative to DM to 2.5%, from 1.2% in 2022. Importantly, the World Bank also suggests in its report that EM growth will remain robust in 2024 and 2025, with an estimated rate of change of 3.9% in 2024 and 4.0% in 2025.
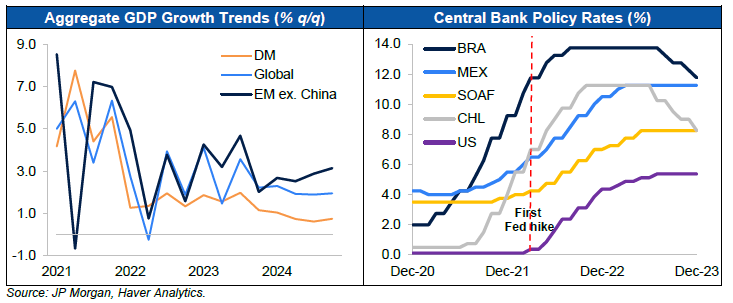
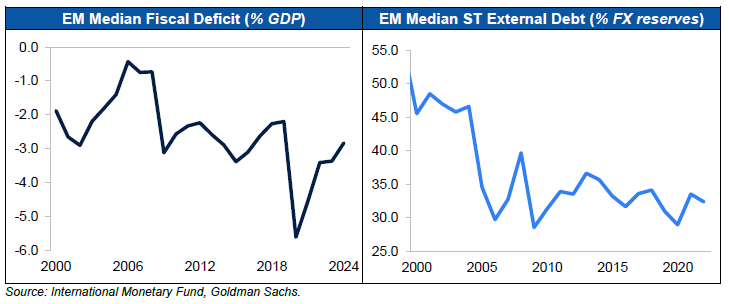
Policy – Major EM economies’ policymaking has displayed prudence and maturity. This was clear on the monetary front, where many of the most significant EM central banks reacted more quickly, and with greater tenacity, to battle post-pandemic inflation forces than their DM counterparts. To illustrate this point, the Fed began hiking rates in March of 2022 and, thus far, has tightened policy rates by 525 bps. Many of the larger policy banks in EM -- notably, Brazil, Hungary, South Africa, Chile, and Mexico -- began hiking rates, on average, nine months before the Fed, reaching terminal rates greater than 400 bps above current Fed target rates. Having successfully and proactively tackled inflation in the near-term, three of the five aforementioned central banks have begun monetary easing, providing tailwinds that could both enable cheaper local funding for governments and help counter economic growth issues. According to a study conducted by JP Morgan, while fiscal deficits remain elevated relative to historical medians, external debt balances are slightly below historical medians. In aggregate, fiscal deterioration was largely contained in 2023 in spite of tighter funding conditions. This is a trend that is likely to improve into 2024. As the IMF points out, median EM fiscal balances in 2024 are expected to improve to -3.0% of GDP, from -3.8% in 2023. Primary balances (or fiscal balances excluding debt service) and debt service as a percentage of revenue, are also expected to improve from -1.0% to -0.7% in aggregate, and from 30% of government revenue to 28.2%. Policy actions, in form, scale, and effectiveness, vary significantly between each credit. Nevertheless, aggregate policy trends for EM are encouraging.
Funding – The confluence of higher funding costs, geopolitical uncertainty, and generally volatile market conditions engendered a challenging funding environment for EM sovereigns once more in 2023. Further evidencing their adaptability and resilience, EM sovereigns were able to pursue a variety of funding alternatives. For the second straight year, sovereign external issuance of $126 billion was well below historical averages. Higher quality issuers that retained market access over this period tapped external funding markets opportunistically when windows of low volatility and constructive sentiment allowed for supply. Still, in many other instances, sovereign issuers avoided international bond markets altogether, choosing instead to fund themselves locally. In 2023, the ratio of EM net local issuance to net hard currency issuance remained substantially higher than historical averages. Concurrently, dependence on foreign investors to absorb local issuance has declined, signaling not only the availability of funding alternatives for sovereigns but also their ability to leverage these alternatives independent of demand from the developed world. Indeed, foreign ownership of EM local debt continued its multi-year decline in 2023 (reaching less than 14% in 2023). Moving forward, local capacity to absorb sovereign issuance is expected to remain intact. JP Morgan highlights that, on average, EM commercial bank holdings of local debt comprise between 5-15% of assets, while EM pension funds hold less than half of their assets in local-denominated securities. For many of the more stressed sovereigns within our landscape, external market access remained out of reach in 2023. For example, HY issuance as a percentage of external sovereign supply fell to just 22% in 2023, lower than 2022 (26%), lower than 2021 (33%), and lower than historical averages. Even for this segment, alternative funding avenues were present in 2023. The increased role of multilateral channels played a large role in ensuring the solvency of more troubled borrowers. For example, the IMF raised annual and cumulative access limits in its General Resources Account from 145% and 435% of quota to 200% and 600% of quota respectively, allowing sovereigns to take advantage of expanded lending limits to ensure greater funding if needed. Other alternative funding solutions included creative debt-for-nature swaps, where new guaranteed debt that benefitted from political risk insurance from the US International Development Finance Corporation and a guarantee from the Inter-American Development Bank, allowed for debt service reductions through buy-backs.
Disclaimers
This presentation and the information contained herein is provided by Marathon Asset Management, L.P. and its affiliates (together, “Marathon”) for educational and informational purposes only and does not constitute and should not be construed as an offering of advisory services or as an invitation, inducement, or offer to sell or solicitation of an offer to buy any securities, related financial instruments, or financial products in any jurisdiction.
This presentation is not research and should not be treated as research. This presentation does not represent valuation judgments with respect to any financial instrument, issuer, security, or sector that may be described or referenced herein and does not represent a formal or official view of Marathon.
The views expressed reflect the current views as of the date hereof, and Marathon does not undertake to advise you of any changes in the views expressed herein. It should not be assumed that Marathon will make investment recommendations in the future that are consistent with the views expressed herein or use any or all the methods of analysis described herein in managing client accounts. Marathon may have positions (long or short) or engage in securities transactions that are not consistent with the information and views expressed in this presentation.
The contents hereof should not be construed as investment, legal, tax or other advice and you should consult your own advisers as to legal, business, tax and other matters related to the investments and business described herein.
The information in these materials does not constitute an offer to sell or the solicitation of an offer to purchase any securities from any entities described herein and may not be used or relied upon in evaluating the merits of investing therein. No such offer or solicitation will be made prior to the delivery of any applicable offering and related subscription or investment advisory materials (together, the “Offering or Advisory Materials”). Offers and sales will be made only pursuant to the Offering or Advisory Materials and in accordance with applicable securities laws.
The information contained herein has been compiled on a preliminary basis as of the dates indicated, and there is no obligation to update the information. The delivery of these materials will under no circumstances create any implication that the information herein has been updated or corrected as of any time subsequent to the date of publication or, as the case may be, the date as of which such information is stated. No representation or warranty, express or implied, is made as to the accuracy or completeness of the information contained herein, and nothing shall be relied upon as a promise or representation as to the future performance of the investments or business described herein.
This document is not intended to represent the rendering of accounting, tax, legal or regulatory advice. A change in the facts or circumstances of any transaction could materially affect the accounting, tax, legal or regulatory treatment for that transaction. The ultimate responsibility for the decision on the appropriate application of accounting, tax, legal and regulatory treatment rests with the investor and his, her or its accountants, tax and regulatory advisors. Investors should consult and must rely on their own professional tax, legal and regulatory advisors as to matters concerning the depicted fund, account or strategy and their investments in the fund, account or strategy. Prospective investors should inform themselves as to: (1) the legal requirements within their own jurisdictions for the purchase, holding or disposal of securities or other assets; (2) applicable foreign exchange restrictions; and (3) any income and other taxes which may apply to their purchase, holding and disposal of securities or other assets or payments in respect of the securities of any depicted fund, account or strategy.
By acceptance hereof, you agree that (i) the information contained herein may not be used, reproduced or distributed to others, in whole or in part, for any other purpose except as expressly provided herein without the prior written consent of Marathon; (ii) you will keep confidential all information contained herein not already in the public domain; and (iii) you will not use such information for any other purpose, including trading in the securities of Marathon-managed entities.
Some of the information used in preparing these materials may have been obtained from or through public or third-party sources. Marathon assumes no responsibility for independent verification of such information and has relied on such information being complete and accurate in all material respects. To the extent such information includes estimates or forecasts obtained from public or third-party sources, we have assumed that such estimates and forecasts have been reasonably prepared. In addition, certain information used in preparing these materials may include cached or stored information generated and stored by Marathon’s systems at a prior date. In some cases, such information may differ from information that would result were the data re-generated on a subsequent date for the same as-of date.
Included analyses may, consequently, differ from those that would be presented if no cached information was used or relied upon.
AN INVESTMENT IN VEHICLES AND INSTRUMENTS OF THE KIND DESCRIBED HEREIN IS SPECULATIVE AND INVOLVES SUBSTANTIAL RISKS, INCLUDING, WITHOUT LIMITATION, RISK OF LOSS. YOU SHOULD CAREFULLY REVIEW THE DISCUSSION OF RISK FACTORS IN THE RELEVANT OFFERING DOCUMENT, SUBSCRIPTION MATERIALS, OR MANAGEMENT AGREEMENT BEFORE DECIDING TO INVEST.
Forward-Looking Statements: Some of the statements in this document constitute forward-looking statements. Forward-looking statements relate to expectations, beliefs, projections, future plans and strategies, anticipated events or trends and similar expressions concerning matters that are not historical facts. The forward looking statements in this presentation involve risks and uncertainties, including statements as to: (i) general volatility of the markets in which we invest; (ii) changes in our business strategy; (iii) availability, terms, and deployment of capital; (iv) availability of qualified personnel; (v) changes in our industry, interest rates, the securities markets or the general economy; (vi) increased rates of default and/or decreased recovery rates on our investments; (vii) changes in governmental regulations, tax rates, and similar matters; (viii) changes in generally accepted accounting principles by standard-setting bodies; and (ix) availability of investment opportunities. The forward-looking statements are based on our beliefs, assumptions, and expectations of our future performance, taking into account all information currently available to us. These beliefs, assumptions, and expectations can change as a result of many possible events or factors, not all of which are known to us or are within our control. If a change occurs, the performance of our portfolio and our business, financial condition, liquidity and results of operations may vary materially from those expressed, anticipated or contemplated in our forward-looking statements.
Definitions of Indices Referenced:
The J.P. Morgan Emerging Markets Global Diversified Index (EMBI Global Diversified) is a uniquely weighted version of the EMBI Global. It limits the weights of those index countries with larger debt stocks by only including specified portions of these countries’ eligible current face amounts of debt outstanding. The countries covered in the EMBI Global Diversified are identical to those covered by the EMBI Global.
Stages
In the fifth century BCE, the Greek philosopher Zeno of Elea proposed the following paradox: suppose the mythical huntress Atalanta, renowned for her running speed and ability to cover great distances, wishes to reach the end of a path to capture a prey. That which is in locomotion must arrive at the halfway stage before it arrives at the goal. For Atalanta to reach her destination, she must first run halfway. Before she can reach the halfway stage, she must first run a quarter of the way. Before traveling a quarter of the way, she must first travel an eighth of the way. Before traveling an eighth of the way, she must first travel a sixteenth of the way, and so on ad infinitum. Thus, as Zeno of Elea’s paradox illustrated, travelling an infinite number of finite distances cannot be completed nor begun, motion is an illusion, change is not possible.
A full rates cycle, or the time between troughs in the federal funds effective rates, includes different stages. The velocity with which one ends and another one begins can vary significantly. The current rate cycle includes the fastest increase in the federal funds rate since the Federal Open Market Committee (“FOMC”) began targeting the effective rate in 1982. This dramatic rate of change motivated the market’s quickly changing sentiment surrounding the rates cycle, which then spurred narrower and quickly evolving interpretations of market conditions. Market sentiment cycled through policy-triggered recession fears, policy-triggered banking fears, goldilocks scenarios, higher for longer duress, and the certainty of peaking rates, all within a span of twelve months. A narrow view or interpretation of events can cloud the perception of movement and fail to capture the possibility of change. A broader view can dispute this lack of change and highlight how an asset class, traversing through a full rate cycle, has positively evolved.
Turbulence
Remarkable shifts in the market’s narrative surrounding rates occurred throughout the calendar year. The year started with the lower bound of the federal funds target rate at 4.25%, and with markets pricing in 50-75 bps of additional rate hikes and the start of a rate cutting cycle before year-end. By the end of February, based on a large upside surprise in US payrolls, the market quickly repriced, leading to 100 bps in expected future hikes. In March, bankruptcies in the financial sector (which included US regional banks Silicon Valley Bank, Signature Bank and First Republic, and global bank Credit Suisse) upended the market narrative once more. Following this banking upheaval, the market quickly priced out most of the assumed hikes, at one point even anticipating 100 bps of rate cuts by year-end. The Federal Reserve (“Fed”), the US Treasury and the FDIC would eventually step in to reassure depositors. Two weeks after the collapse of Silicon Valley Bank, the Fed would deliver the second hike of the year. Over the following months, the Fed delivered two additional hikes, in May and in July, reaching a target rate lower bound of 5.25%.
Despite this historically aggressive tightening, the US economy remained persistently strong, fueling a negative narrative built upon concerns over the potential economic consequences of structurally higher for longer rates. Concerns were heightened by a third quarter Fed release; the September Fed Summary of Economic Projections showed a revised view, where 10 out of 19 Fed officials believed that rates should be above 5.0% by the end of 2024. Eventually, weaker payroll data and softer-than-expected CPI prints during the last few weeks of the year would serve to boost market sentiment. While at many times fearing that motion is an illusion and that change is not possible, market perception finally arrived at the conclusion that the Fed was reaching the halfway point of the rates cycle.
Reaction
Spreads – In a year marked by the highest rates volatility since the Great Recession, EM spreads remained remarkably contained. Over the course of 2023, spreads for the Index compressed 69 bps, from 452 bps to a year-end close of 383 bps. Most of this spread compression was seen in the high yield (“HY”) segment of the Index, where EM HY spreads compressed 122 bps, from 823 bps to a year end close of 701 bps. A further segmentation of spreads based on credit rating reveals signs of market resilience. For example, when we consider EM Investment Grade (“IG”), which represents the majority of the market cap of our Index, the spread differential between the year’s maximum and minimum levels stood at only 46 bps. Even at the height of policy-triggered banking fears, IG spreads had only widened 26 bps relative to the start of the year. Even at the height of the peaking rates end-of-year euphoria, IG spreads had only tightened 18 bps relative to the start of the year. If we conduct a similar exercise for all EM, excluding jurisdictions where spreads reached above 1,000 bps during 2023, data points suggest a similar pattern. This pool of credits oscillated throughout the turbulent year between a maximum of 274 bps and a minimum of 192 bps, or within an 83 bps spread range. Notably, within this spread context, EM’s relative value proposition stands firm. When we compare EM to a basket of US High Grade and US HY, EM spreads stand above 141 bps, well above historical averages of approximately 53 bps over the last decade.
Ratings – In 2023, there were more EM sovereign credit rating upgrades than downgrades; a data point that suggests resilience. EM experienced 16 sovereign upgrades versus 10 downgrades. According to S&P, the balance of outlooks on sovereign ratings at the end of 2023 (positive minus negative) stands at negative 3, compared with negative 13 in December 2022. For 2024, 11 sovereigns are on a positive outlook, while 14 are on a negative outlook. Fitch ratings shows a similar stabilization trend, with a balanced picture in terms of upgrades and downgrades, or a net upgrade of one in 2023. The outlook for 2024 is similarly balanced, with approximately 10 ratings on both positive and negative outlooks.
Defaults – The pandemic-induced global economic crisis elevated concerns surrounding the potential for a wave of defaults within the EM universe. In 2020, following the adoption of social mitigation policies which brought global economic activity to a near halt, credits that were already dealing with pre-pandemic struggles were forced to default or restructure, such as Argentina and Ecuador. Given the negative effects of rising rates, concerns surrounding the potential for numerous defaults once again resurfaced. Evidence suggests that these concerns were once again overstated. Since the Fed began to raise the target rate, and even while the magnitude of change has been historically unprecedented, defaults remain subdued. Two instances of sovereign defaults occurred in 2022 and one instance in 2023. In December 2023, Ethiopia (approximately 10 bps weight in the Index) opted for non-payment on a coupon of its $1 billion 2024 bond after reaching an agreement in principle with official and bilateral creditors on a debt service suspension, while the government holds talks with the International Monetary Fund (“IMF”).
Moving Forward
Over the centuries, philosophers and theoretical mathematicians have grappled with the implications of Zeno's paradox on concepts of motion, change, and infinity. Many struggled to negate its conclusion that true advancement is impossible. EM has endured notable shocks both internally and externally in recent history. For market participants, it can be easy to fall victim to Zeno's premise, specifically, that EM is in a permanent state of emergence. On the contrary, the performance of the asset class through the accelerated and pronounced hiking cycle serves as evidence of positive motion and positive change. EM has reached a stage of resilience. Reaching this stage of resilience was aided by a diverse set of positive developments, including the underlying strength of local economies, proactive policy initiatives, and reduced funding dependency on external public markets.
Growth – Since global central banks began raising rates, fears of a pronounced slowdown in economic activity have remained part of the macroeconomic discussion. Defying some market participants’ expectations, developed markets (“DM”) have been able to avoid a recession. Aggregate DM managed to record positive estimated GDP growth of 1.5% for 2023, down from 2.5% for 2022. The World Bank recently released its updated economic global output report. In the report, the World Bank assumes DM will be able to avoid a recession through the next chapters of the rates cycle, with estimated growth forecasts of 1.2% in 2024 and 1.6% in 2025. Along with DM, EM has displayed remarkable economic endurance. For 2022, EM recorded a 3.7% growth rate in a year where China, facing a variety of issues, only grew by 3.0%. The World Bank estimates that EM grew by 4.0% in 2023, increasing the growth differential relative to DM to 2.5%, from 1.2% in 2022. Importantly, the World Bank also suggests in its report that EM growth will remain robust in 2024 and 2025, with an estimated rate of change of 3.9% in 2024 and 4.0% in 2025.
Policy – Major EM economies’ policymaking has displayed prudence and maturity. This was clear on the monetary front, where many of the most significant EM central banks reacted more quickly, and with greater tenacity, to battle post-pandemic inflation forces than their DM counterparts. To illustrate this point, the Fed began hiking rates in March of 2022 and, thus far, has tightened policy rates by 525 bps. Many of the larger policy banks in EM -- notably, Brazil, Hungary, South Africa, Chile, and Mexico -- began hiking rates, on average, nine months before the Fed, reaching terminal rates greater than 400 bps above current Fed target rates. Having successfully and proactively tackled inflation in the near-term, three of the five aforementioned central banks have begun monetary easing, providing tailwinds that could both enable cheaper local funding for governments and help counter economic growth issues. According to a study conducted by JP Morgan, while fiscal deficits remain elevated relative to historical medians, external debt balances are slightly below historical medians. In aggregate, fiscal deterioration was largely contained in 2023 in spite of tighter funding conditions. This is a trend that is likely to improve into 2024. As the IMF points out, median EM fiscal balances in 2024 are expected to improve to -3.0% of GDP, from -3.8% in 2023. Primary balances (or fiscal balances excluding debt service) and debt service as a percentage of revenue, are also expected to improve from -1.0% to -0.7% in aggregate, and from 30% of government revenue to 28.2%. Policy actions, in form, scale, and effectiveness, vary significantly between each credit. Nevertheless, aggregate policy trends for EM are encouraging.
Funding – The confluence of higher funding costs, geopolitical uncertainty, and generally volatile market conditions engendered a challenging funding environment for EM sovereigns once more in 2023. Further evidencing their adaptability and resilience, EM sovereigns were able to pursue a variety of funding alternatives. For the second straight year, sovereign external issuance of $126 billion was well below historical averages. Higher quality issuers that retained market access over this period tapped external funding markets opportunistically when windows of low volatility and constructive sentiment allowed for supply. Still, in many other instances, sovereign issuers avoided international bond markets altogether, choosing instead to fund themselves locally. In 2023, the ratio of EM net local issuance to net hard currency issuance remained substantially higher than historical averages. Concurrently, dependence on foreign investors to absorb local issuance has declined, signaling not only the availability of funding alternatives for sovereigns but also their ability to leverage these alternatives independent of demand from the developed world. Indeed, foreign ownership of EM local debt continued its multi-year decline in 2023 (reaching less than 14% in 2023). Moving forward, local capacity to absorb sovereign issuance is expected to remain intact. JP Morgan highlights that, on average, EM commercial bank holdings of local debt comprise between 5-15% of assets, while EM pension funds hold less than half of their assets in local-denominated securities. For many of the more stressed sovereigns within our landscape, external market access remained out of reach in 2023. For example, HY issuance as a percentage of external sovereign supply fell to just 22% in 2023, lower than 2022 (26%), lower than 2021 (33%), and lower than historical averages. Even for this segment, alternative funding avenues were present in 2023. The increased role of multilateral channels played a large role in ensuring the solvency of more troubled borrowers. For example, the IMF raised annual and cumulative access limits in its General Resources Account from 145% and 435% of quota to 200% and 600% of quota respectively, allowing sovereigns to take advantage of expanded lending limits to ensure greater funding if needed. Other alternative funding solutions included creative debt-for-nature swaps, where new guaranteed debt that benefitted from political risk insurance from the US International Development Finance Corporation and a guarantee from the Inter-American Development Bank, allowed for debt service reductions through buy-backs.
Disclaimers
This presentation and the information contained herein is provided by Marathon Asset Management, L.P. and its affiliates (together, “Marathon”) for educational and informational purposes only and does not constitute and should not be construed as an offering of advisory services or as an invitation, inducement, or offer to sell or solicitation of an offer to buy any securities, related financial instruments, or financial products in any jurisdiction.
This presentation is not research and should not be treated as research. This presentation does not represent valuation judgments with respect to any financial instrument, issuer, security, or sector that may be described or referenced herein and does not represent a formal or official view of Marathon.
The views expressed reflect the current views as of the date hereof, and Marathon does not undertake to advise you of any changes in the views expressed herein. It should not be assumed that Marathon will make investment recommendations in the future that are consistent with the views expressed herein or use any or all the methods of analysis described herein in managing client accounts. Marathon may have positions (long or short) or engage in securities transactions that are not consistent with the information and views expressed in this presentation.
The contents hereof should not be construed as investment, legal, tax or other advice and you should consult your own advisers as to legal, business, tax and other matters related to the investments and business described herein.
The information in these materials does not constitute an offer to sell or the solicitation of an offer to purchase any securities from any entities described herein and may not be used or relied upon in evaluating the merits of investing therein. No such offer or solicitation will be made prior to the delivery of any applicable offering and related subscription or investment advisory materials (together, the “Offering or Advisory Materials”). Offers and sales will be made only pursuant to the Offering or Advisory Materials and in accordance with applicable securities laws.
The information contained herein has been compiled on a preliminary basis as of the dates indicated, and there is no obligation to update the information. The delivery of these materials will under no circumstances create any implication that the information herein has been updated or corrected as of any time subsequent to the date of publication or, as the case may be, the date as of which such information is stated. No representation or warranty, express or implied, is made as to the accuracy or completeness of the information contained herein, and nothing shall be relied upon as a promise or representation as to the future performance of the investments or business described herein.
This document is not intended to represent the rendering of accounting, tax, legal or regulatory advice. A change in the facts or circumstances of any transaction could materially affect the accounting, tax, legal or regulatory treatment for that transaction. The ultimate responsibility for the decision on the appropriate application of accounting, tax, legal and regulatory treatment rests with the investor and his, her or its accountants, tax and regulatory advisors. Investors should consult and must rely on their own professional tax, legal and regulatory advisors as to matters concerning the depicted fund, account or strategy and their investments in the fund, account or strategy. Prospective investors should inform themselves as to: (1) the legal requirements within their own jurisdictions for the purchase, holding or disposal of securities or other assets; (2) applicable foreign exchange restrictions; and (3) any income and other taxes which may apply to their purchase, holding and disposal of securities or other assets or payments in respect of the securities of any depicted fund, account or strategy.
By acceptance hereof, you agree that (i) the information contained herein may not be used, reproduced or distributed to others, in whole or in part, for any other purpose except as expressly provided herein without the prior written consent of Marathon; (ii) you will keep confidential all information contained herein not already in the public domain; and (iii) you will not use such information for any other purpose, including trading in the securities of Marathon-managed entities.
Some of the information used in preparing these materials may have been obtained from or through public or third-party sources. Marathon assumes no responsibility for independent verification of such information and has relied on such information being complete and accurate in all material respects. To the extent such information includes estimates or forecasts obtained from public or third-party sources, we have assumed that such estimates and forecasts have been reasonably prepared. In addition, certain information used in preparing these materials may include cached or stored information generated and stored by Marathon’s systems at a prior date. In some cases, such information may differ from information that would result were the data re-generated on a subsequent date for the same as-of date.
Included analyses may, consequently, differ from those that would be presented if no cached information was used or relied upon.
AN INVESTMENT IN VEHICLES AND INSTRUMENTS OF THE KIND DESCRIBED HEREIN IS SPECULATIVE AND INVOLVES SUBSTANTIAL RISKS, INCLUDING, WITHOUT LIMITATION, RISK OF LOSS. YOU SHOULD CAREFULLY REVIEW THE DISCUSSION OF RISK FACTORS IN THE RELEVANT OFFERING DOCUMENT, SUBSCRIPTION MATERIALS, OR MANAGEMENT AGREEMENT BEFORE DECIDING TO INVEST.
Forward-Looking Statements: Some of the statements in this document constitute forward-looking statements. Forward-looking statements relate to expectations, beliefs, projections, future plans and strategies, anticipated events or trends and similar expressions concerning matters that are not historical facts. The forward looking statements in this presentation involve risks and uncertainties, including statements as to: (i) general volatility of the markets in which we invest; (ii) changes in our business strategy; (iii) availability, terms, and deployment of capital; (iv) availability of qualified personnel; (v) changes in our industry, interest rates, the securities markets or the general economy; (vi) increased rates of default and/or decreased recovery rates on our investments; (vii) changes in governmental regulations, tax rates, and similar matters; (viii) changes in generally accepted accounting principles by standard-setting bodies; and (ix) availability of investment opportunities. The forward-looking statements are based on our beliefs, assumptions, and expectations of our future performance, taking into account all information currently available to us. These beliefs, assumptions, and expectations can change as a result of many possible events or factors, not all of which are known to us or are within our control. If a change occurs, the performance of our portfolio and our business, financial condition, liquidity and results of operations may vary materially from those expressed, anticipated or contemplated in our forward-looking statements.
Definitions of Indices Referenced:
The J.P. Morgan Emerging Markets Global Diversified Index (EMBI Global Diversified) is a uniquely weighted version of the EMBI Global. It limits the weights of those index countries with larger debt stocks by only including specified portions of these countries’ eligible current face amounts of debt outstanding. The countries covered in the EMBI Global Diversified are identical to those covered by the EMBI Global.
